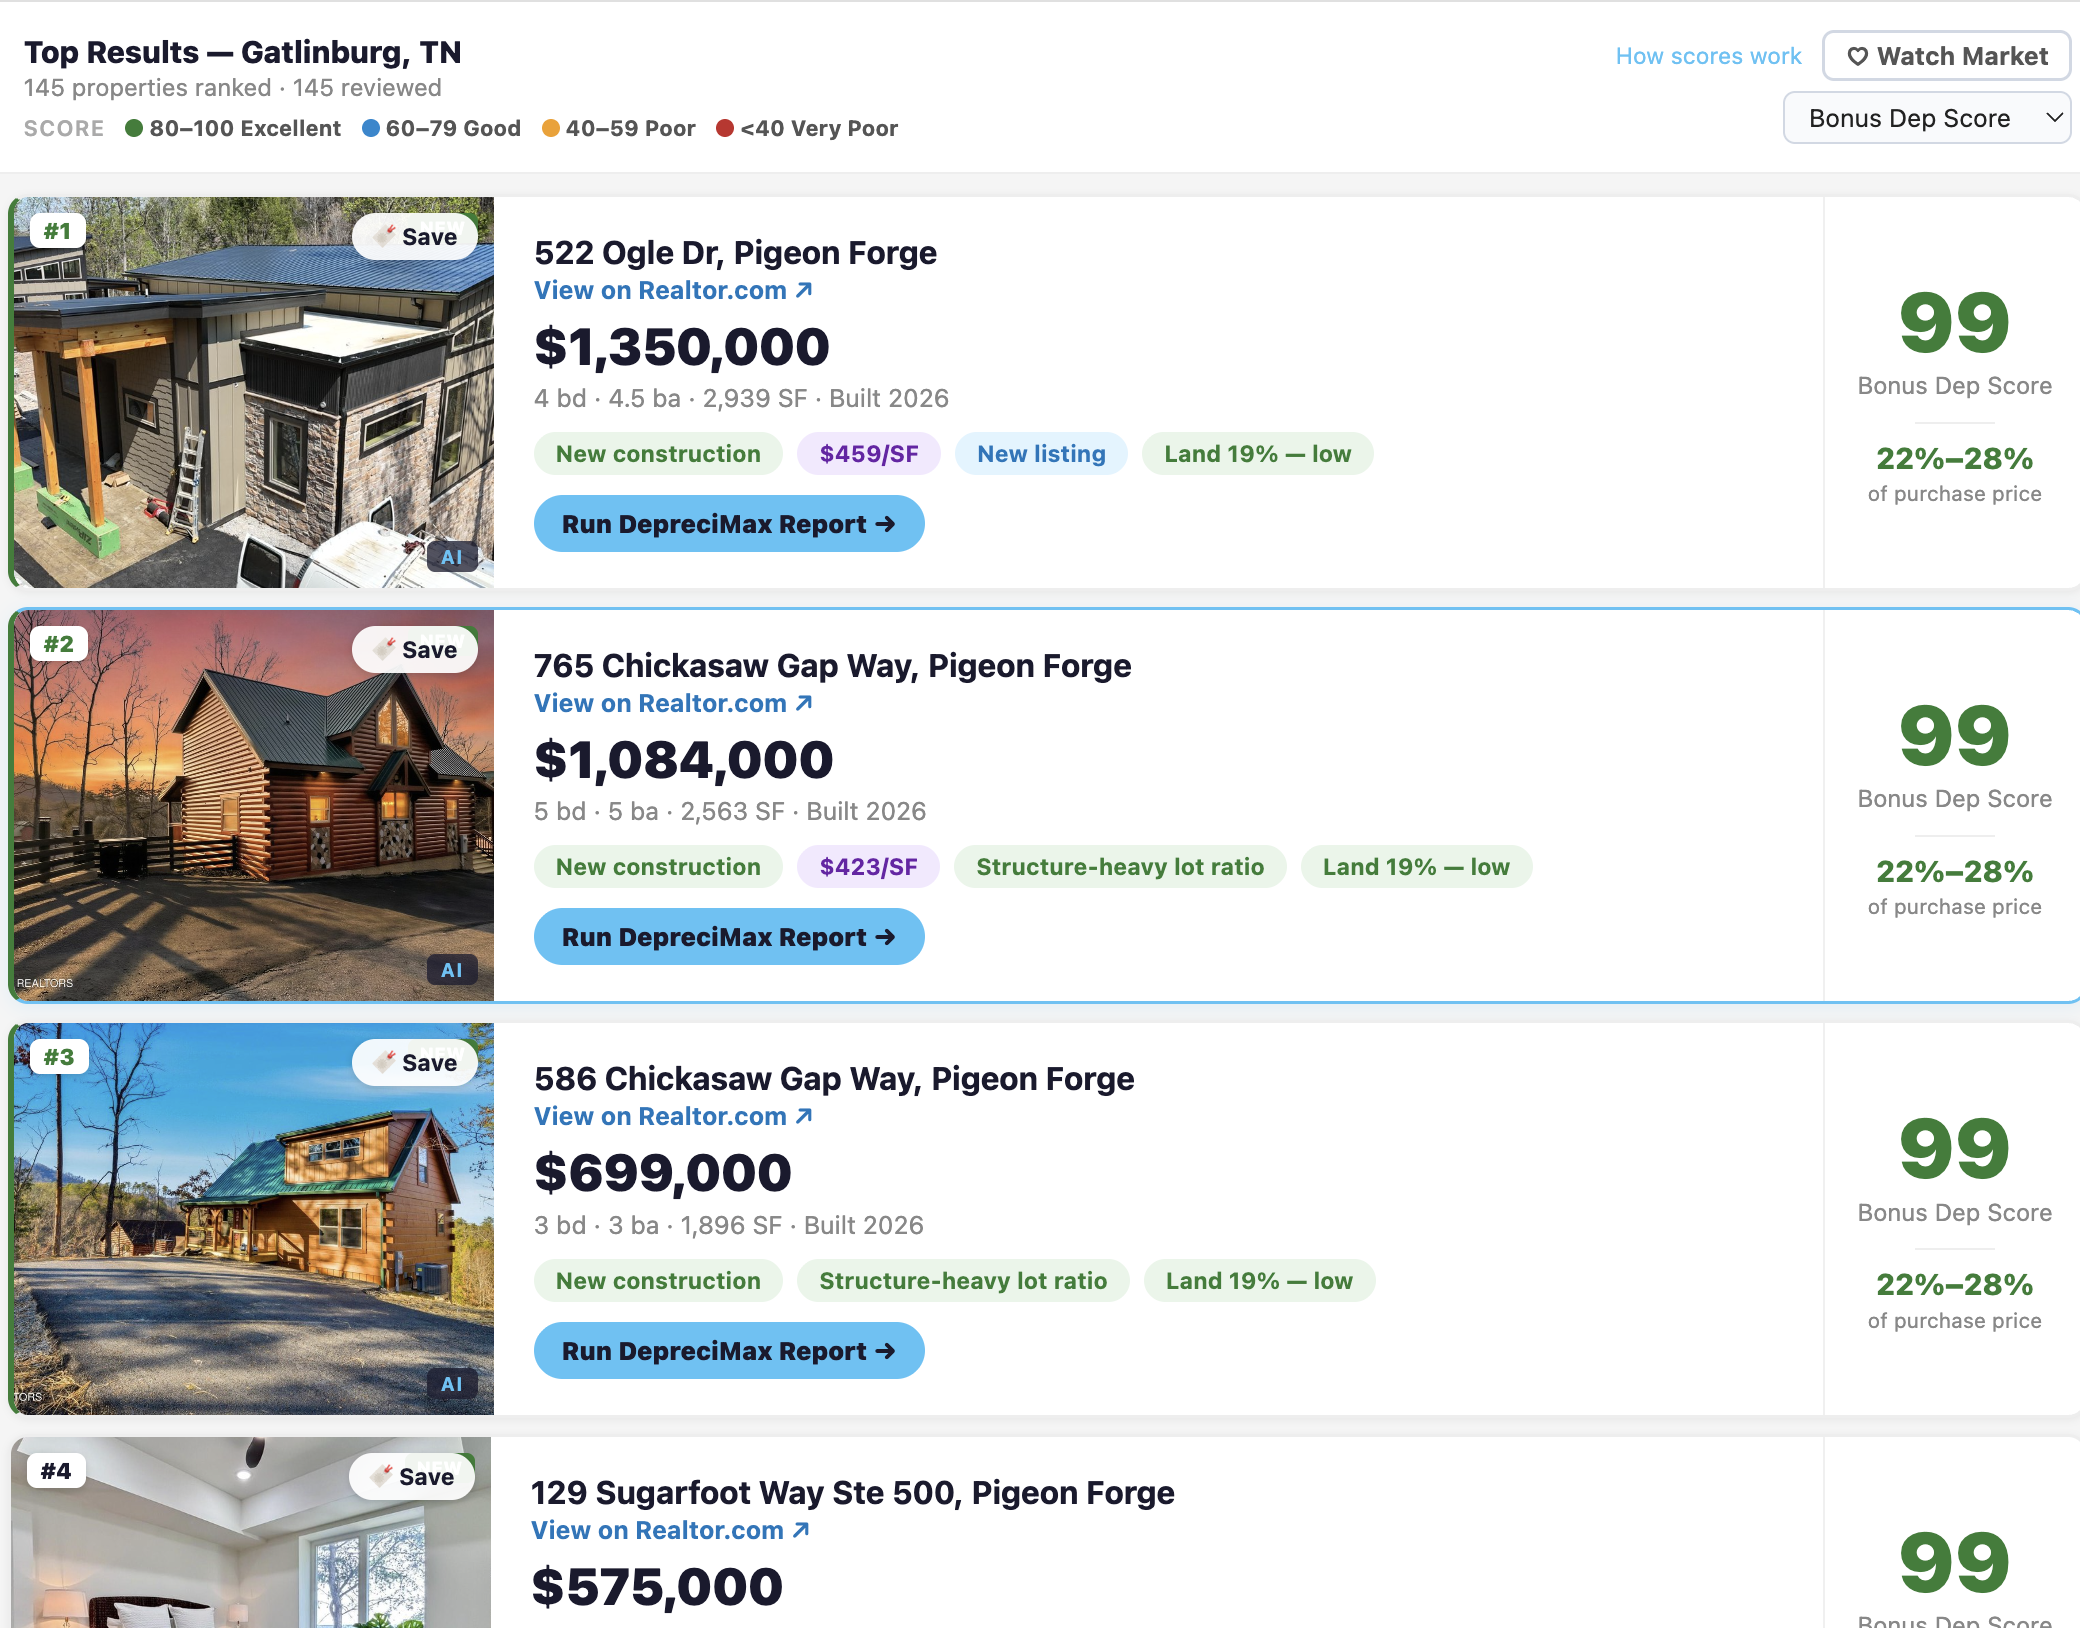
TL;DR — The best cabin STR markets for bonus depreciation in 2026 are Pigeon Forge TN, Broken Bow OK, Blue Ridge GA, Hocking Hills OH, and Lake Harmony PA. Across the top 10 listings in each (50 properties total), the median Year 1 bonus depreciation deduction was $185,000 — 28% of purchase price — on a median $715,000 cabin, translating to roughly $68,500 in federal tax savings at a 37% bracket. Blue Ridge produced the highest absolute dollar deductions ($222,000 median); Pigeon Forge and Blue Ridge tied for the highest deduction percentage. Each market is broken down in detail below.
For high-W2 earners, pairing bonus depreciation with the short-term rental loophole is one of the only legal ways to convert real estate losses into a direct offset against wage income — which is why the market you buy in matters as much as the strategy itself.
If you've spent any time on real-estate Twitter or BiggerPockets, you've heard cabin investments called the "STR cheat code." The reason isn't just nightly rates — it's the cabin Airbnb tax math under IRS §168(k) bonus depreciation.
A typical cabin in the right market is loaded with reclassifiable assets: hot tubs, indoor theaters, arcade rooms, oversized decks, fire pits, outdoor kitchens, hardscaping, and FF&E packages designed to attract Instagram bookings. Almost every one of those line items lands in a 5-year or 15-year property bucket under IRS §168(k) — instead of the 27.5-year residential schedule under IRS §168(c) that drags down most rentals. (For the foundational mechanics, see The STR Loophole Explained.)
We pulled the top 10 cabin listings (by DepreciMax bonus depreciation score) from five leading cabin markets on April 28, 2026 — 50 properties total — to ground this in real numbers.
The headline: Across 50 top cabin listings analyzed, the median Year 1 bonus depreciation deduction was $185,000 — 28% of purchase price. At a 37% federal tax bracket, that translates to ~$68,500 in federal tax savings. The median property cost $715,000.
How DepreciMax scored these properties. Every active listing was ranked using land value ratio, year built, price per square foot, property type, and amenity signals from listing copy and photos. The scoring model is calibrated against a known benchmark: a $1,250,000 Ketchum, ID property with a formal Madison SPECS cost segregation study showing 18.9% bonus-eligible — DepreciMax's estimate falls within 4% of that figure. All bonus depreciation calculations assume 100% bonus depreciation under the Tax Relief for American Families and Workers Act of 2025 and the active-activity exception for short-term rentals under Reg. §1.469-1T(e)(3)(ii)(A). Tax savings shown at a 37% federal marginal bracket. Pulled from active for-sale listings April 28, 2026.
The 5 cabin markets at a glance
| Market | Median Price | Land % | Median Y1 $ | Median Y1 % | Tax Savings @ 37% |
|---|---|---|---|---|---|
| Pigeon Forge, TN | $614,000 | 19% | $172,000 | 28.0% | $63,600 |
| Broken Bow, OK | $789,500 | 12% | $179,000 | 22.6% | $66,200 |
| Blue Ridge, GA | $792,500 | 15% | $222,000 | 28.0% | $82,100 |
| Hocking Hills, OH | $767,000 | 15% | $155,000 | 21.7% | $57,400 |
| Lake Harmony, PA | $554,000 | 22% | $121,000 | 22.1% | $44,800 |
| Top 50 aggregate | $715,000 | 15% | $185,000 | 28.0% | $68,500 |
A single cabin purchase in one of these markets, when paired with active STR participation and material participation hours, can wipe out $45,000–$82,000 of W-2 income tax in Year 1. For high-bracket earners running a deal-screening process, that's the kind of math that changes which markets you target.
Cabin markets tend to concentrate at the top of the Lake and Mountain categories in our 2026 STR Bonus Depreciation Market Study, which ranks 197 US STR markets by median bonus-eligible share and puts Lake Cumberland, KY at #1 (27.1% median), followed by Lake Harmony PA, Branson MO, and Angel Fire NM.
Why cabins outperform other STR categories on bonus depreciation
Most short-term rentals share the same basic structural cost profile — foundation, framing, roof, drywall, rough plumbing, rough electrical. None of that is bonus-eligible; it depreciates over 27.5 years. The differentiator is what the IRS classifies under §168(k) as 5-year personal property (finishes, FF&E, decorative fixtures) and 15-year qualified improvement property and land improvements (pools, hot tubs, fire pits, decks, hardscaping, outdoor kitchens). Both categories are 100% bonus-eligible for property placed in service in 2025 and beyond.
Cabins built for the STR market are designed around those exact categories. A purpose-built Smokies cabin typically includes:
- Hot tub on covered porch (15-year)
- Outdoor fire pit and gathering area (15-year)
- Indoor theater room with projector and recliners (5-year)
- Arcade or game room with multiple machines (5-year)
- High-end finishes — barnwood, stone counters, vessel sinks (5-year)
- Furnished with $40k–$80k of FF&E that conveys with the property (5-year)
- Wraparound deck with multiple levels (15-year)
- Landscaping, paved driveway, retaining walls (15-year)
Stack all of that on top of a structurally simple wood-frame build, and the ratio of bonus-eligible value to total purchase price is dramatically higher than a comparable beach condo or urban townhouse. (For a head-to-head comparison see Cabin vs Condo vs Luxury STR: Which Maximizes Bonus Depreciation?.)
What's the number on the property you're looking at?
Upload 7–9 listing photos. Our AI returns a line-item Year 1 deduction estimate closely calibrated to a $5,000–$12,000 cost seg study.
Run a Property Report — $99 →The 5 cabin markets we analyzed
1. Pigeon Forge / Gatlinburg / Sevierville, TN — The Smokies
The undisputed king. Sevier County does ~13M visitors per year, and cabins here are purpose-built for STRs — hot tubs, theaters, and game rooms are table stakes.
Where to look: Wears Valley (less saturated than the Pigeon Forge core, easier zoning), Cobbly Nob (Gatlinburg-side premium), Sevierville hilltop developments (newer builds, modern amenity stacks).
2. Broken Bow, OK (Beavers Bend / Hochatown)
The fastest-growing cabin market in the country since 2020. Drive distance to Dallas (3.5 hrs) and OKC (3 hrs) means consistent weekend demand at meaningfully lower entry prices than the Smokies.
Where to look: Hochatown core (highest nightly rates, tightest occupancy), Stevens Gap (newer luxury builds, larger lots). The amenity gap between premium and standard builds is wider here than in the Smokies, so property selection matters more.
3. Blue Ridge, GA
The Atlanta drive market's premium cabin destination. Roughly 90 minutes from the metro, strong year-round occupancy with fall foliage as the peak. Properties trend slightly larger and more upscale than Broken Bow.
Where to look: Aska Adventure Area, Cherry Lake / Old Highway 76 corridor. Highest median deduction dollar amount in our analysis, driven by premium price points combined with amenity-loaded builds. (See also Smoky Mountains vs Blue Ridge: Which Cabin Market Wins on Bonus Depreciation?)
4. Hocking Hills, OH (Logan area)
The sleeper pick. Drive market for Columbus, Cleveland, Cincinnati, and Pittsburgh — pricing still 30–40% below the Smokies. Treehouses, A-frames, and design-forward cabins are the differentiator.
Where to look: Logan and South Bloomingville core, ~15 min from Old Man's Cave. Smaller market with fewer amenity-stacked listings — but for investors targeting cap rate over total deduction dollars, the lower entry prices and underbuilt competition matter.
5. Lake Harmony, PA (Poconos)
NYC and Philly's backyard. Higher land allocation drags down the deduction percentage, but unmatched proximity to two of the largest STR demand bases in the country.
Where to look: Lake Harmony, Pocono Pines, Albrightsville (less restrictive zoning). Lowest median price in the analysis means more accessible entry, even if the deduction percentage trails the Southeast markets.
What separates a top-10 cabin from a middle-of-pack cabin in these markets
Across all 50 listings analyzed, the highest scoring properties shared a small set of recurring traits:
- Newer construction (post-2018). Modern systems, code-compliant pools and hot tubs, current FF&E. Older cabins have higher 39-year structural shares.
- Multiple amenity layers. Hot tub and theater and game room and outdoor kitchen — not just one or two. Stacked amenities compound 5-year and 15-year deductions.
- Furnished sale ("turn-key for STR"). When FF&E conveys, the cost basis transfers and goes straight to 5-year property. Unfurnished sales lose this entirely.
- Lower-than-market land allocation. Smaller wooded lots tucked into resort communities tend to score better than properties on multi-acre parcels with road frontage.
- Listing copy that signals the build-out. Specific mentions of theater rooms, arcade machines, hot tub brands, and FF&E packages tell you the seller built for STR economics.
What this analysis doesn't capture (and why the report matters)
The numbers above are pre-purchase scoring estimates — useful for narrowing a market and ranking listings, but not engineered to closely calibrated to formal cost seg's bonus-eligible %. Two important caveats:
- The scoring engine is heuristic. It looks at price, square footage, age, listing copy, and amenity signals — not photo content. A property with a stunning custom build and $90k of FF&E may score similarly to a comparable property without those things.
- Land ratio is a market-level estimate. Real assessor data per-property can differ from the market average — sometimes meaningfully. A cabin on a smaller lot or in a tighter subdivision may have a lower land allocation than the surrounding average.
That's what the full $99 DepreciMax property report addresses. You upload 7–9 listing photos, and DepreciMax's algorithm reads every visible finish, fixture, amenity, and FF&E item — classifying each by IRS §168(k) category. Land ratio is sourced from county assessor data per-property. The output is a line-item bonus dep estimate closely calibrated to formal cost segregation studies, in the form of a filing-ready PDF you can hand to your CPA. (For the full pre-purchase workflow, see How to Use IRS §168(k) Before Closing.)
Find a cabin worth running a report on.
Have an address? Run a Property Report and get a line-item Year 1 deduction estimate closely calibrated to a $5k–$12k cost seg study's bonus-eligible %.
Run a Property Report — $99 →Frequently asked questions
Why are cabin rentals so good for bonus depreciation?
Cabin STRs are typically loaded with reclassifiable assets — hot tubs, indoor theaters, arcade rooms, oversized decks, fire pits, outdoor kitchens, and FF&E packages — that fall into 5-year personal property and 15-year land improvement categories under IRS §168(k). These categories are 100% bonus-eligible. A typical premium cabin produces a Year 1 bonus depreciation deduction of 22–28% of purchase price, well above the 12–18% range for most beach and urban STRs.
Which cabin market has the highest bonus depreciation potential?
Across our analysis of 50 top cabin listings in 5 markets, Pigeon Forge / Sevierville / Gatlinburg, TN and Blue Ridge, GA both produced 100% top-scoring listings — every analyzed property hit the maximum bonus depreciation score. Blue Ridge produced the highest median Year 1 deduction in absolute dollars ($222,000) due to its combination of premium price points and amenity-loaded builds.
How much can I deduct on a $700,000 cabin in Year 1?
On a $700,000 cabin purchase in a top market like Pigeon Forge or Blue Ridge, a typical Year 1 bonus depreciation deduction lands in the $155,000–$200,000 range (22–28% of purchase price). At a 37% federal tax bracket, that translates to approximately $57,000–$74,000 in federal tax savings — assuming the investor materially participates in the STR activity and maintains an average guest stay under 7 days.
Why does Broken Bow have lower deduction percentages than the Smokies?
Broken Bow has a wider amenity gap between premium and standard builds than the Smokies — meaning property selection matters more. The lowest land allocation in our 5-market analysis (12%) means strong leverage on the improvement basis, but the average top-10 listing scored 22.6% Y1 deduction vs. 28% for the Smokies. The takeaway: in Broken Bow, work harder to identify the amenity-loaded cabins (hot tubs, theaters, fire pits) and skip the basic builds.
What's the difference between a market scoring estimate and a formal cost seg study?
DepreciMax's market scoring is a pre-purchase screening tool — it ranks listings using land value ratio, age, price per square foot, and amenity signals from listing data. The full DepreciMax property report ($99) runs DepreciMax's algorithm on 7–9 listing photos, classifying every visible finish and amenity by IRS §168(k) category, and produces a line-item estimate closely calibrated to formal cost segregation studies. A formal cost seg study ($5,000–$15,000) sends an engineer to the property and is required for IRS audit defense — the $99 report supports the offer-stage decision.
Estimates based on top 10 listings (by DepreciMax bonus depreciation score) in each of the 5 markets analyzed, pulled April 2026. Actual results vary by property, jurisdiction, ownership structure, material participation, and tax situation. This article is for educational purposes only and does not constitute tax or legal advice. Consult a qualified CPA before implementing any tax strategy.