★★★★★
I’d been quoted $4,800 for a cost seg and couldn’t justify it on a property I might not even buy. Five minutes and $99 told me it was worth doing. Easiest yes in the whole deal.

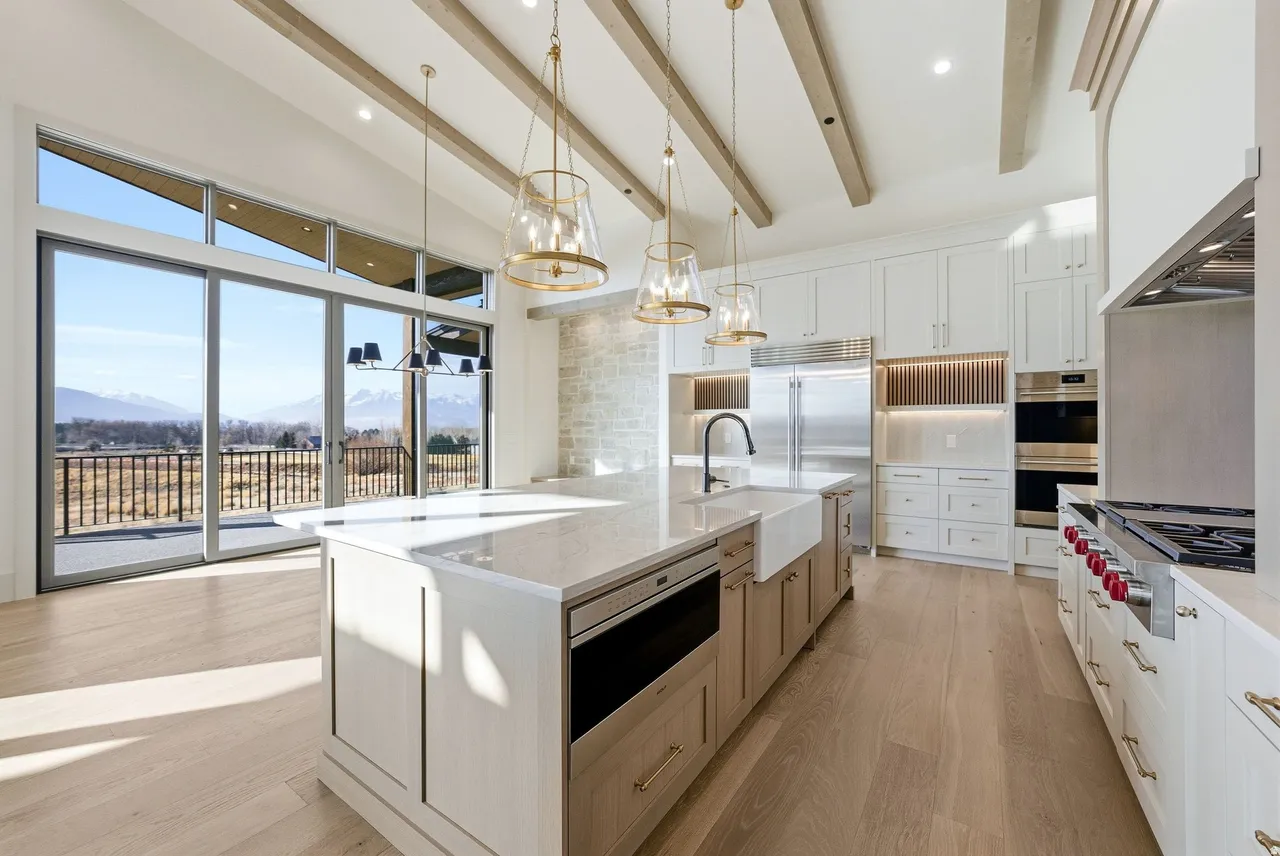
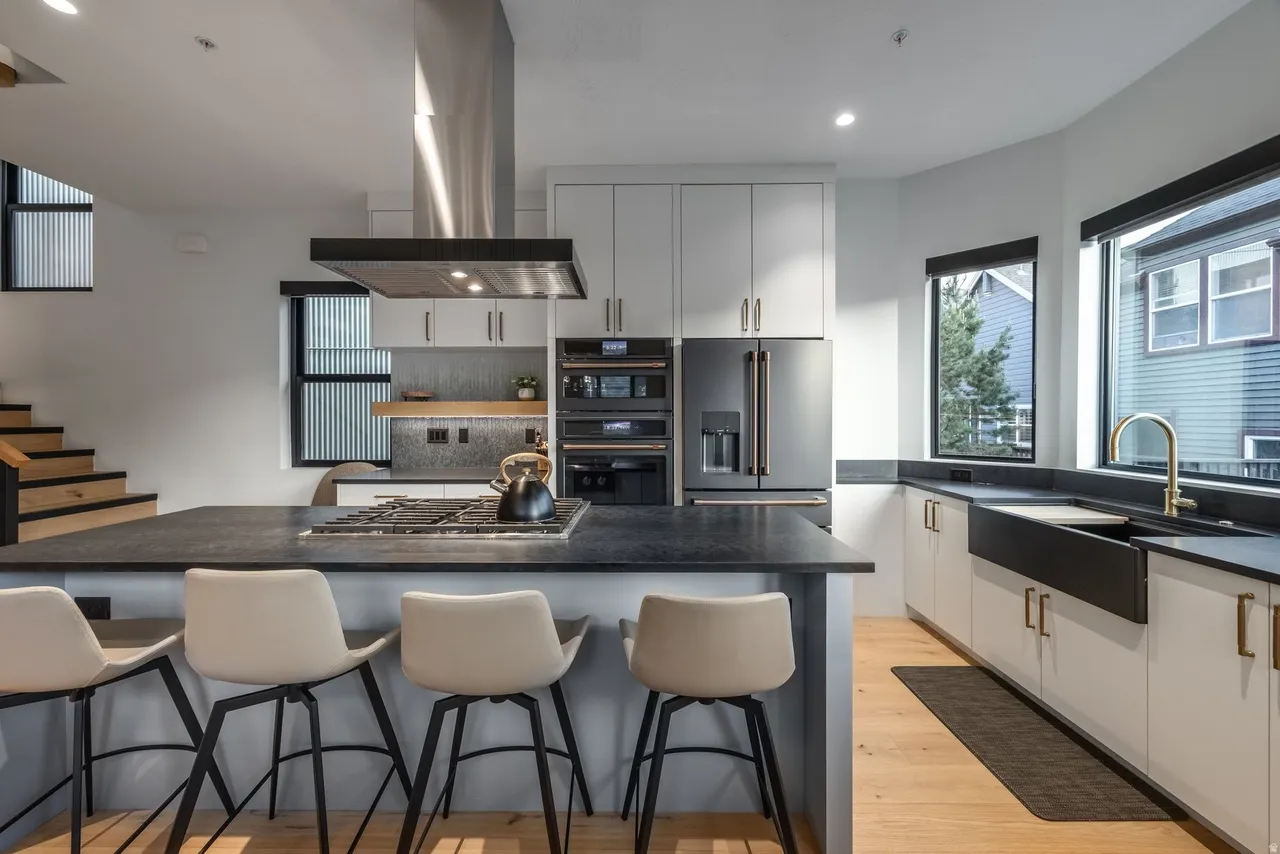
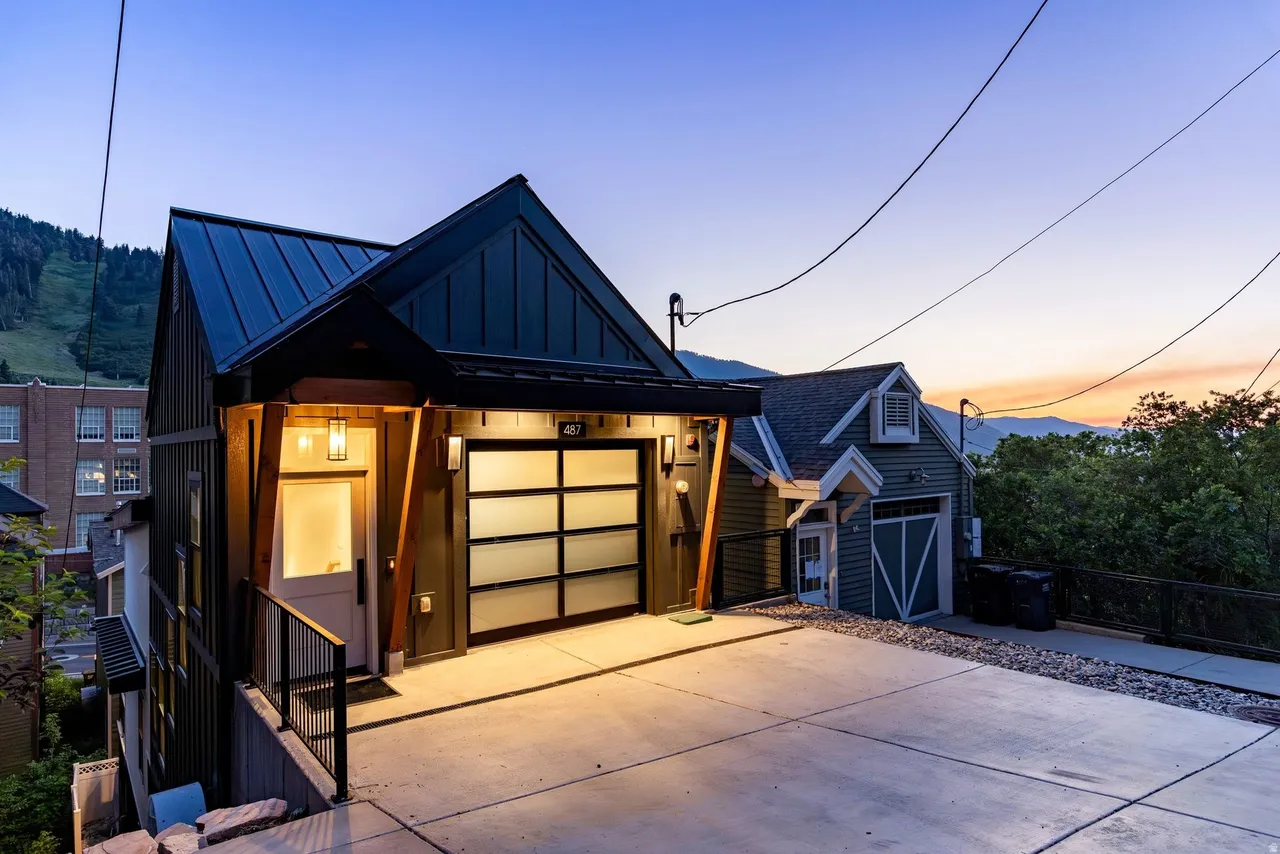
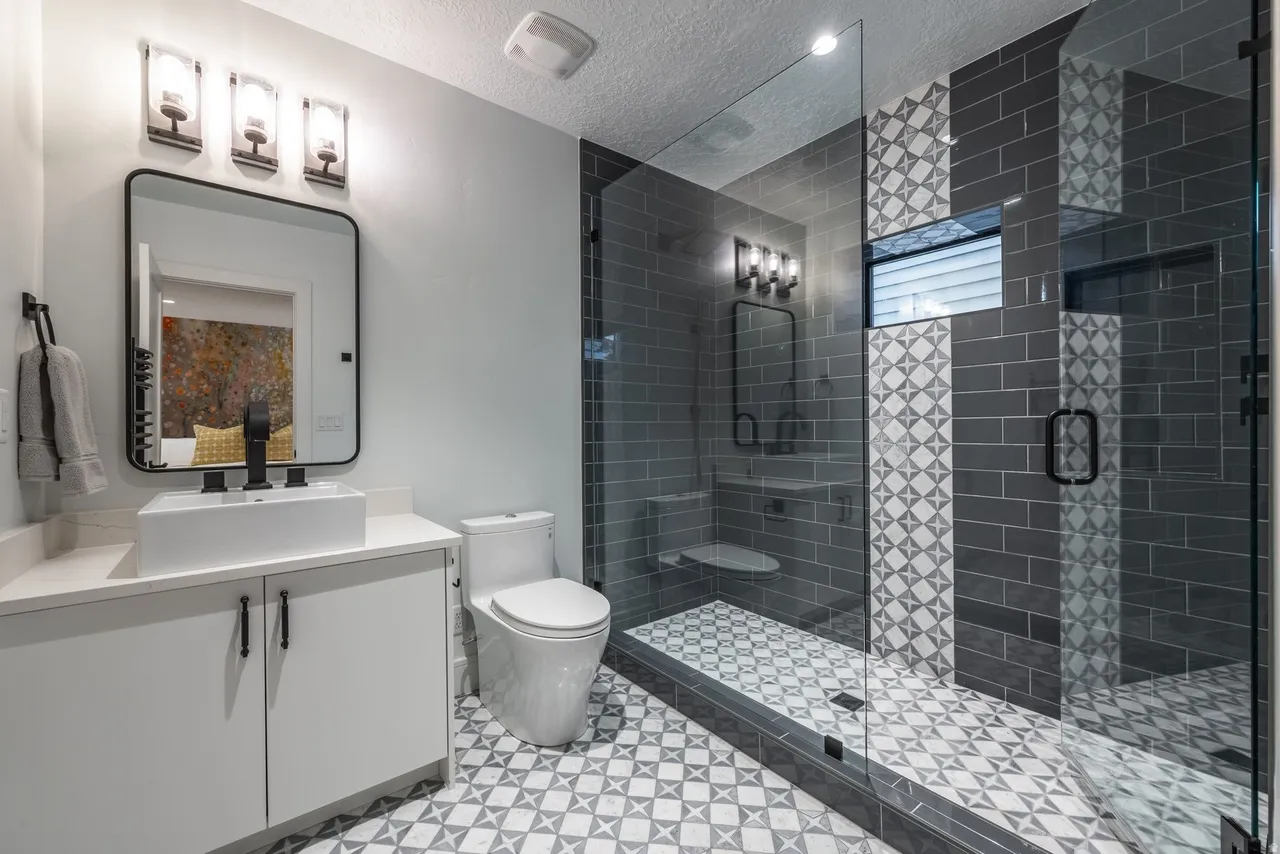
By the numbers
Over 3,000 bonus depreciation reports run to date
I’d been quoted $4,800 for a cost seg and couldn’t justify it on a property I might not even buy. Five minutes and $99 told me it was worth doing. Easiest yes in the whole deal.
I used DepreciMax for two STR properties I purchased in Big Bear. The reports are extremely accurate, and they actually helped me find a few write-offs the cost seg firm missed. Planning to use them for all of my future purchases and to help narrow down my next investment region!
I was deciding between two Smokies cabins at the same price. DepreciMax showed one would deliver 24% bonus depreciation, the other 11%.
The largest ranking of US short-term rental markets by IRS §168(k) bonus depreciation potential. 197 markets analyzed. Lake Cumberland, KY leads at 27.1% median bonus-eligible share of purchase price — with a worked case study on a $2.995M Joshua Tree property that hits $803,596 in bonus-eligible property.
Free calculators guess. Formal cost seg studies cost $5,000–$8,000 and happen after closing. DepreciMax uses engineer-grade AI photo analysis of every listing photo — assets classified and valued the way a cost seg study would — plus county assessor data to give you a calibrated Year 1 deduction estimate before you make an offer, for $99.
| Free Tools$0 | DepreciMax$99 | Formal Cost Seg$5k–$8k | |
|---|---|---|---|
| Available before you close | ✓ | ✓ | After closing |
| Market & property screening | ✓ | ✓ | — |
| AI photo analysis — every finish classified | — | ✓ | ✓ |
| 5-yr / 15-yr / 39-yr line-item breakdown | — | ✓ | ✓ |
| County assessor land value data | — | ✓ | ✓ |
| IRS-defensible for tax filing | — | Estimate only * | ✓ |
| Typical cost | $0 | $99 | $5,000–$8,000 |
Most STR buyers learn their depreciation after closing. DepreciMax moves that decision upstream. Screen where the tax math works, shortlist the high-tier properties, and lock in the Year-1 number before the offer.
Explore ~200 short-term rental markets ranked by Year-1 bonus depreciation and Diamond & Gold property density. Focus your search where the tax math already works.
See every active listing in your market ranked by depreciation potential. Our tool surfaces the Diamond and Gold candidates — the top 25% for Year-1 write-off — without giving away the score.
Pick a finalist and get the exact Year-1 write-off, an itemized depreciation analysis, and a Diamond/Gold/Silver/Bronze tier vs its market and the national field — calibrated to formal cost seg studies. Before you offer.